
Page 9 - TechDawn_Magazine_Term2 .pptx
P. 9
GRADE 5
Data Organisation, Charts & Creative Coding with Excel
Excel & Data Skills Pixel Art & Conditional Formatting
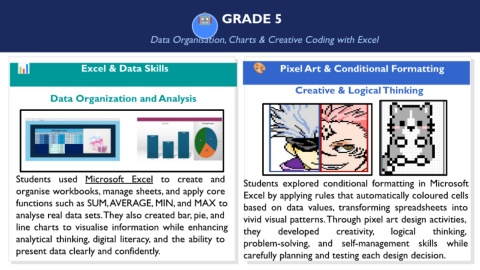
Creative & Logical Thinking
Data Organization and Analysis
Students used Microsoft Excel to create and
Students explored conditional formatting in Microsoft
organise workbooks, manage sheets, and apply core
Excel by applying rules that automatically coloured cells
functions such as SUM, AVERAGE, MIN, and MAX to
based on data values, transforming spreadsheets into
analyse real data sets. They also created bar, pie, and
vivid visual patterns. Through pixel art design activities,
line charts to visualise information while enhancing
they developed creativity, logical thinking,
analytical thinking, digital literacy, and the ability to
problem-solving, and self-management skills while
present data clearly and confidently.
carefully planning and testing each design decision.